Home›About›Case Studies
CASE STUDIES

Case Studies & Results Measurable, Transparent, Real

All results you see here are real client data. Numbers, timelines and strategies are exactly as they happened.

0+
Projects delivered
0%
Average organic traffic growth
0
Industry sectors covered
0 yrs
SEO & GEO consulting experience
Get a Free SEO Audit →
GOOGLE SEARCH CONSOLE

Real Results from Search Console

Unedited Google Search Console screenshots from projects I work on. Client names are withheld for confidentiality; each card compares a period with the previous period or the same period last year.

Why do average CTR and position sometimes look worse? When impressions grow sharply, the site starts appearing for many new, lower-ranked queries. Those new impressions pull the averages down even while clicks rise. Clicks and impressions are the metrics that show growth.

Project 1

Clicks
12.5K → 125K
Impressions
123K → 2.19M
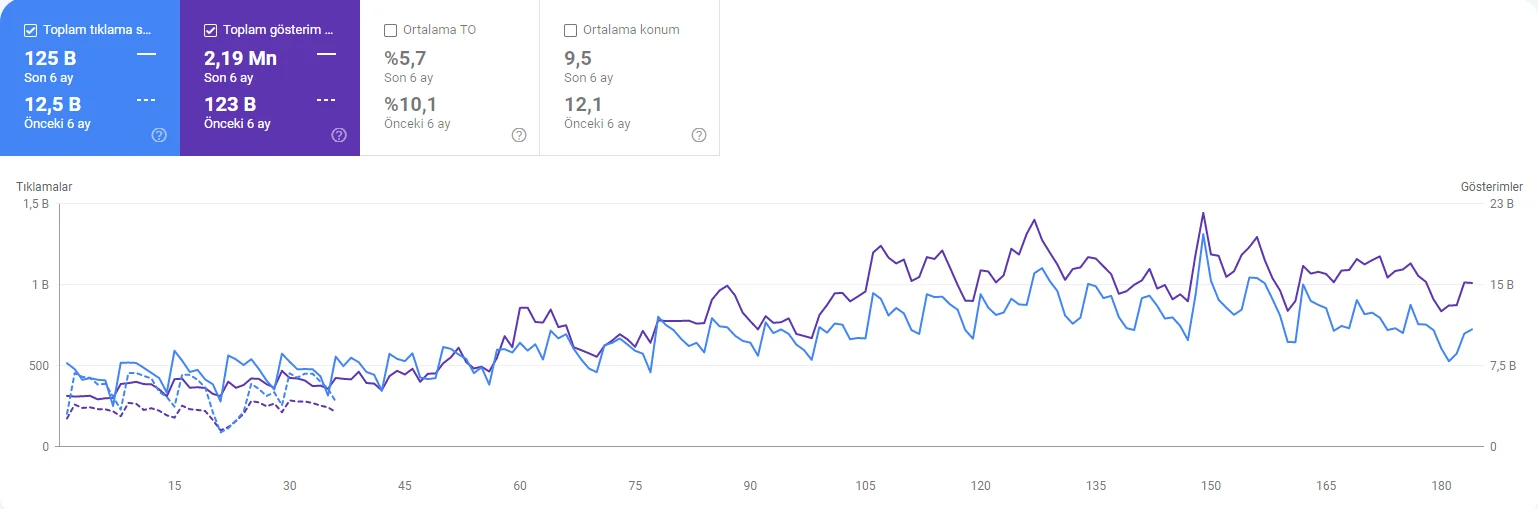
Google Search Console performance chart, project 1, last 6 months: clicks 12.5K to 125K, impressions 123K to 2.19M

Google Search Console, last 6 months vs. previous 6 months. Part of the comparison period has no data, so no growth multiple is shown.

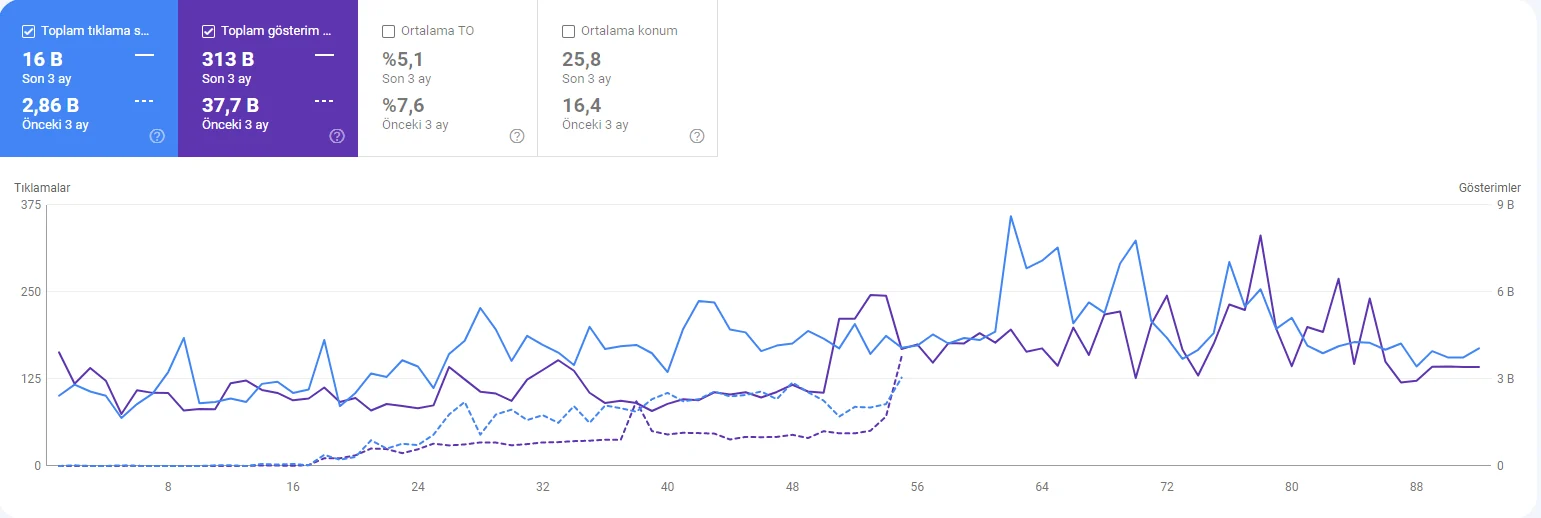
Project 2

Clicks
2,860 → 16K
Impressions
37.7K → 313K
Google Search Console performance chart, project 2, last 3 months: clicks 2,860 to 16K, impressions 37.7K to 313K

Google Search Console, last 3 months vs. previous 3 months. Part of the comparison period has no data, so no growth multiple is shown.

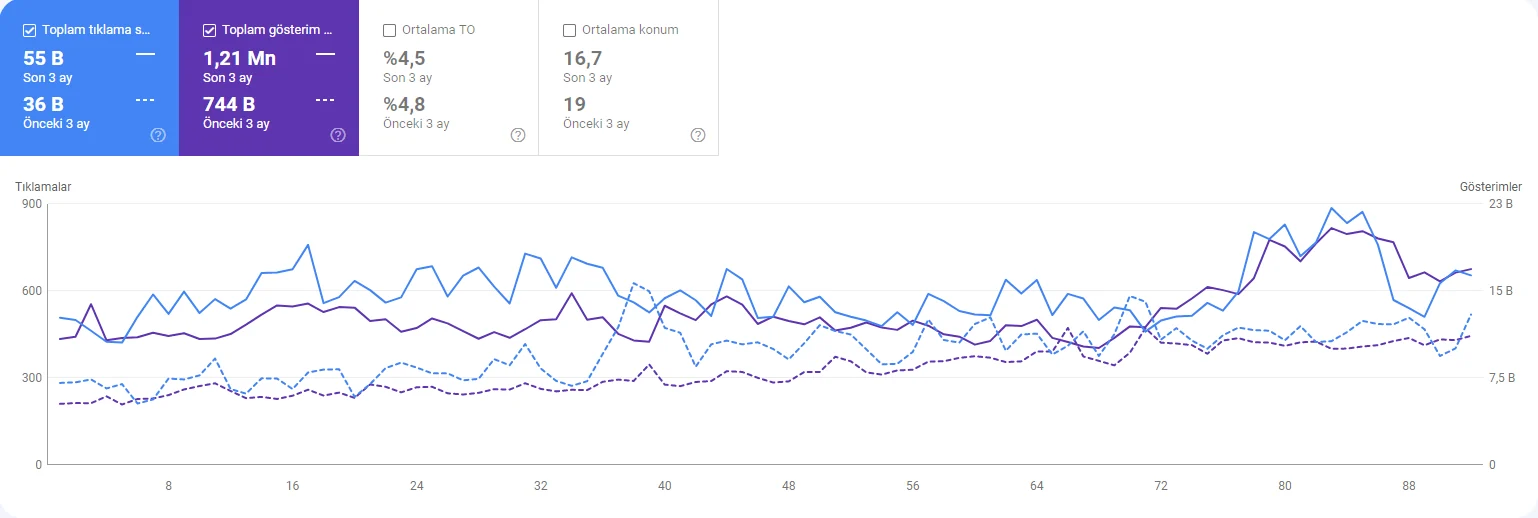
Project 3

Clicks
36K → 55K
+53%
Impressions
744K → 1.21M
+63%
Google Search Console performance chart, project 3, last 3 months: clicks 36K to 55K, impressions 744K to 1.21M

Google Search Console, last 3 months vs. previous 3 months.

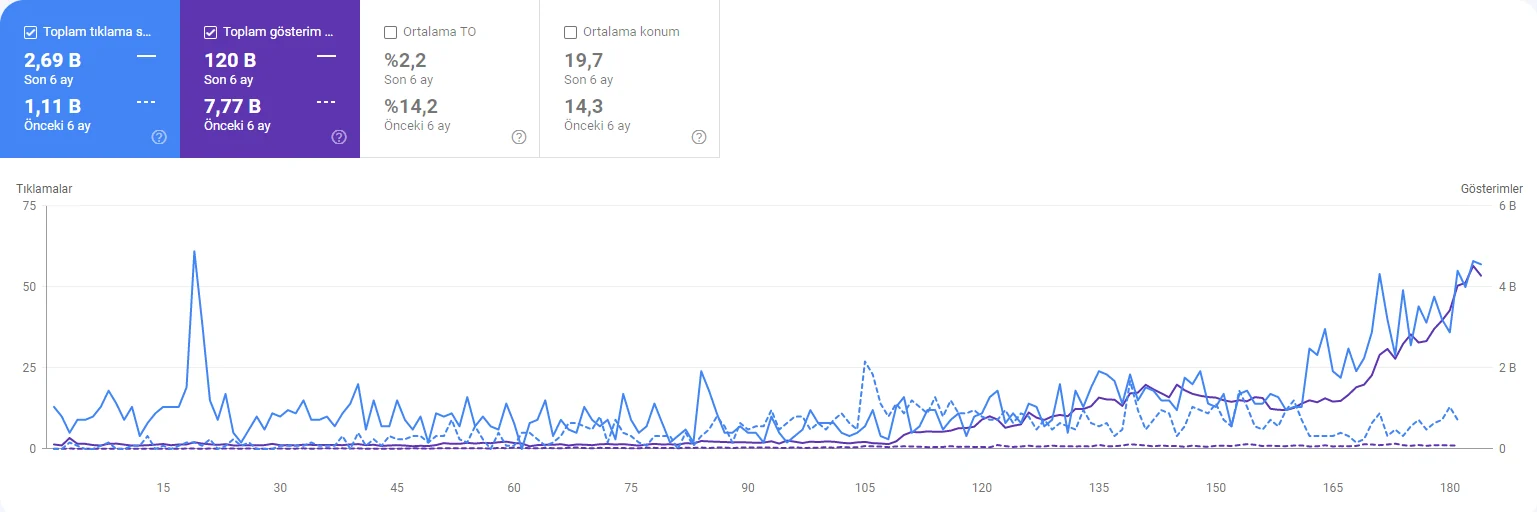
Project 4

Clicks
1,110 → 2,690
×2.4
Impressions
7,770 → 120K
×15
Google Search Console performance chart, project 4, last 6 months: clicks 1,110 to 2,690, impressions 7,770 to 120K

Google Search Console, last 6 months vs. previous 6 months.

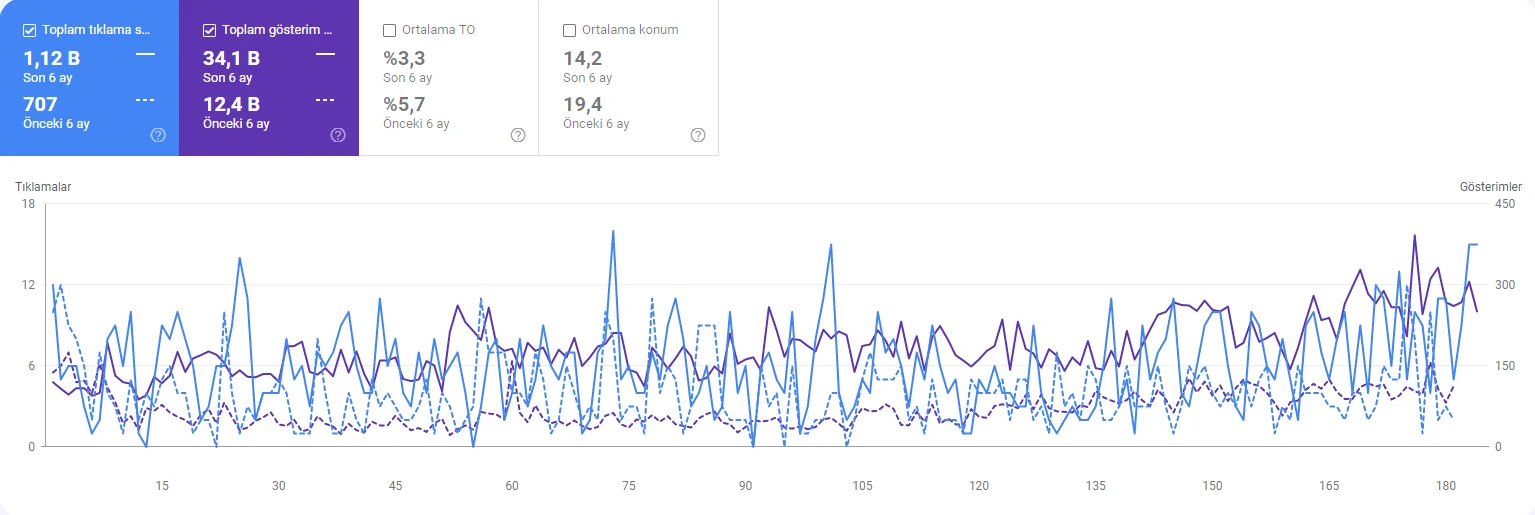
Project 5

Clicks
707 → 1,120
+58%
Impressions
12.4K → 34.1K
×2.8
Google Search Console performance chart, project 5, last 6 months: clicks 707 to 1,120, impressions 12.4K to 34.1K

Google Search Console, last 6 months vs. previous 6 months.

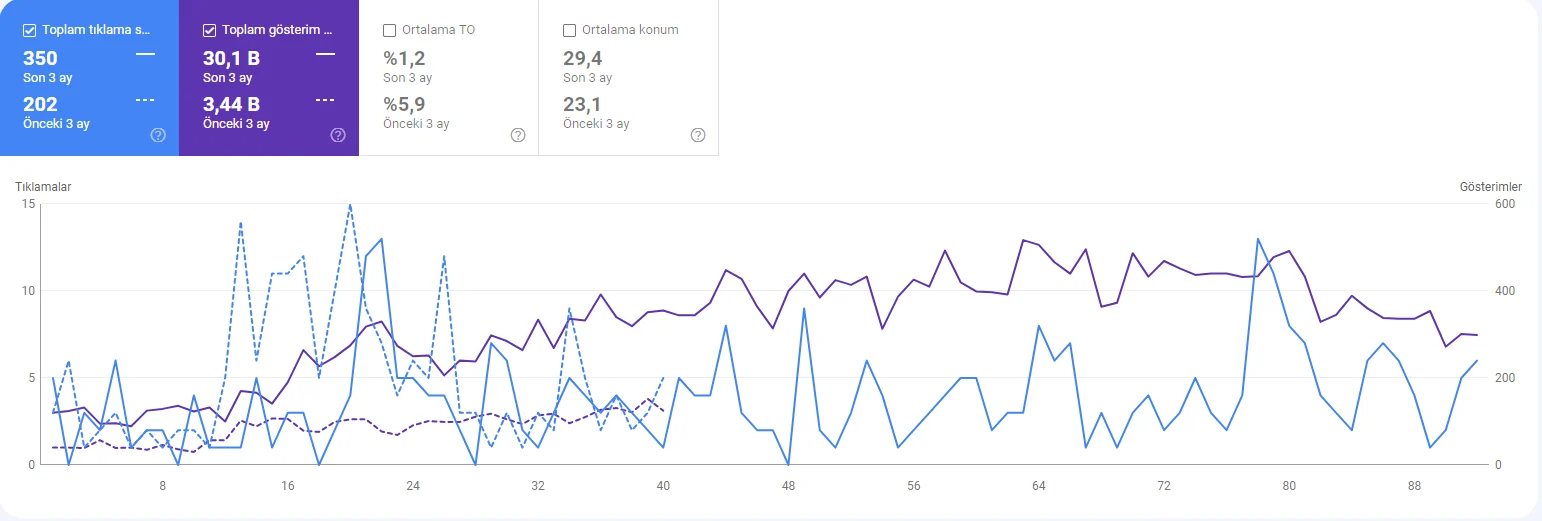
Project 6

Clicks
202 → 350
+73%
Impressions
3,440 → 30.1K
×8.8
Google Search Console performance chart, project 6, last 3 months: clicks 202 to 350, impressions 3,440 to 30.1K

Google Search Console, last 3 months vs. previous 3 months.

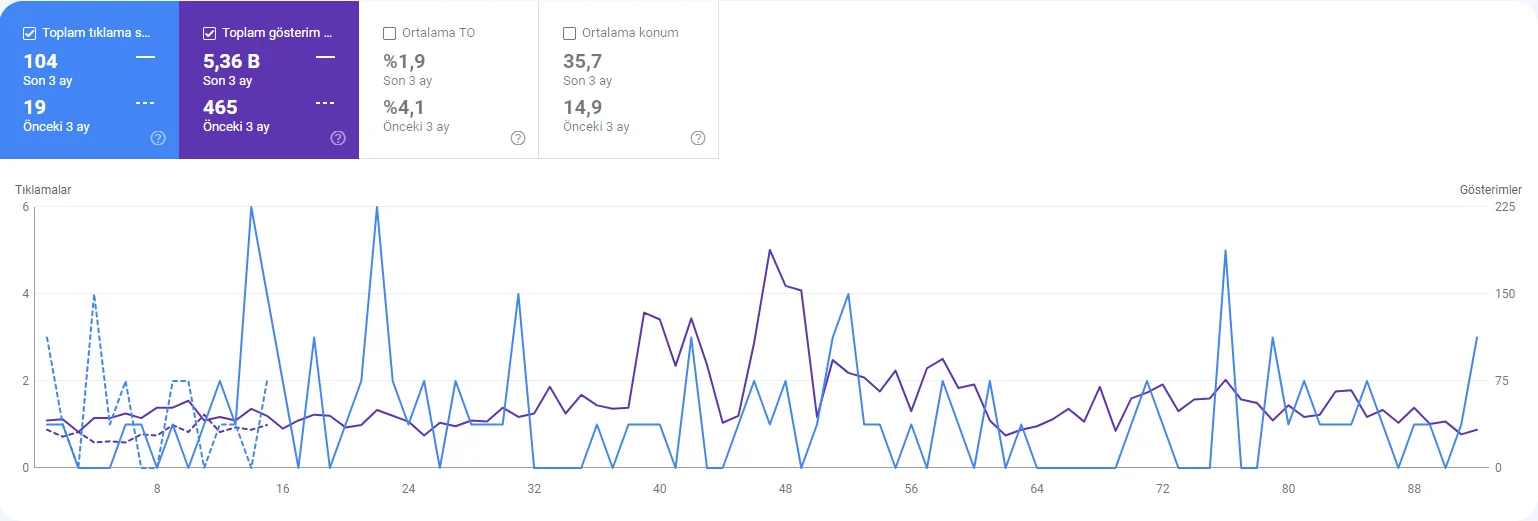
Project 7

Clicks
19 → 104
Impressions
465 → 5,360
Google Search Console performance chart, project 7, last 3 months: clicks 19 to 104, impressions 465 to 5,360

Google Search Console, last 3 months vs. previous 3 months. Part of the comparison period has no data, so no growth multiple is shown.

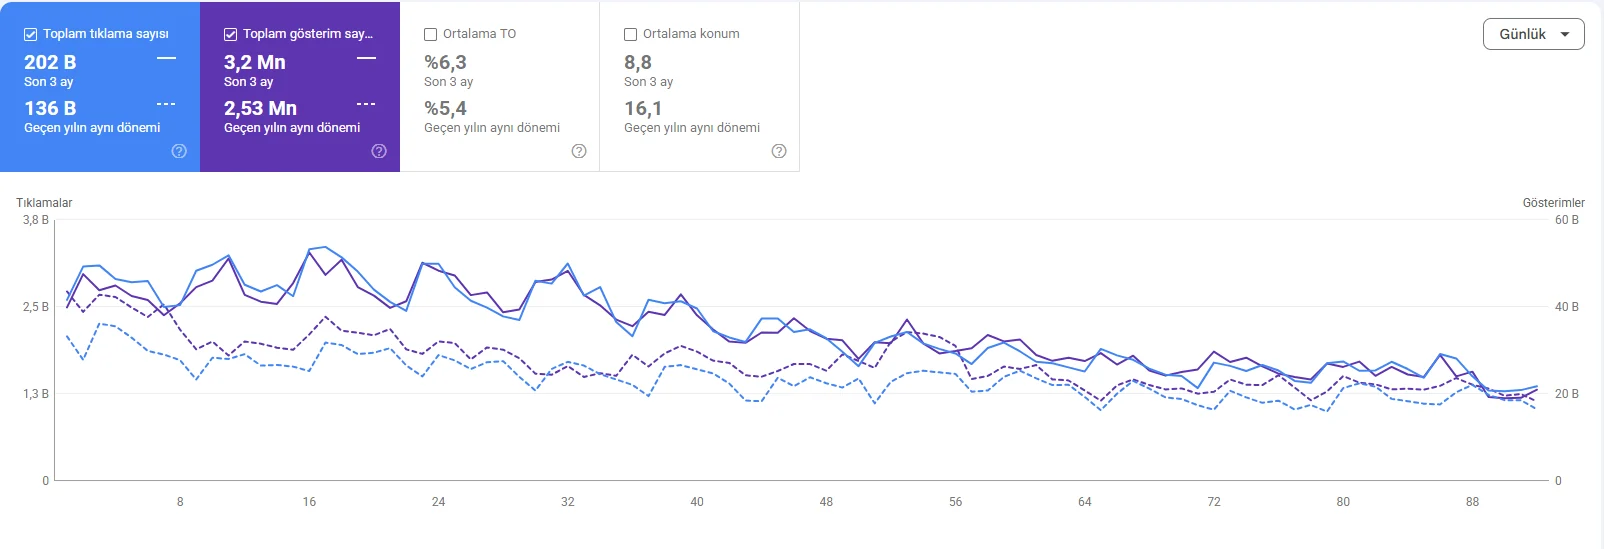
Project 8

Clicks
136K → 202K
+49%
Impressions
2.53M → 3.2M
+26%
Google Search Console performance chart, project 8, last 3 months: clicks 136K to 202K, impressions 2.53M to 3.2M

Google Search Console, last 3 months vs. the same period last year.

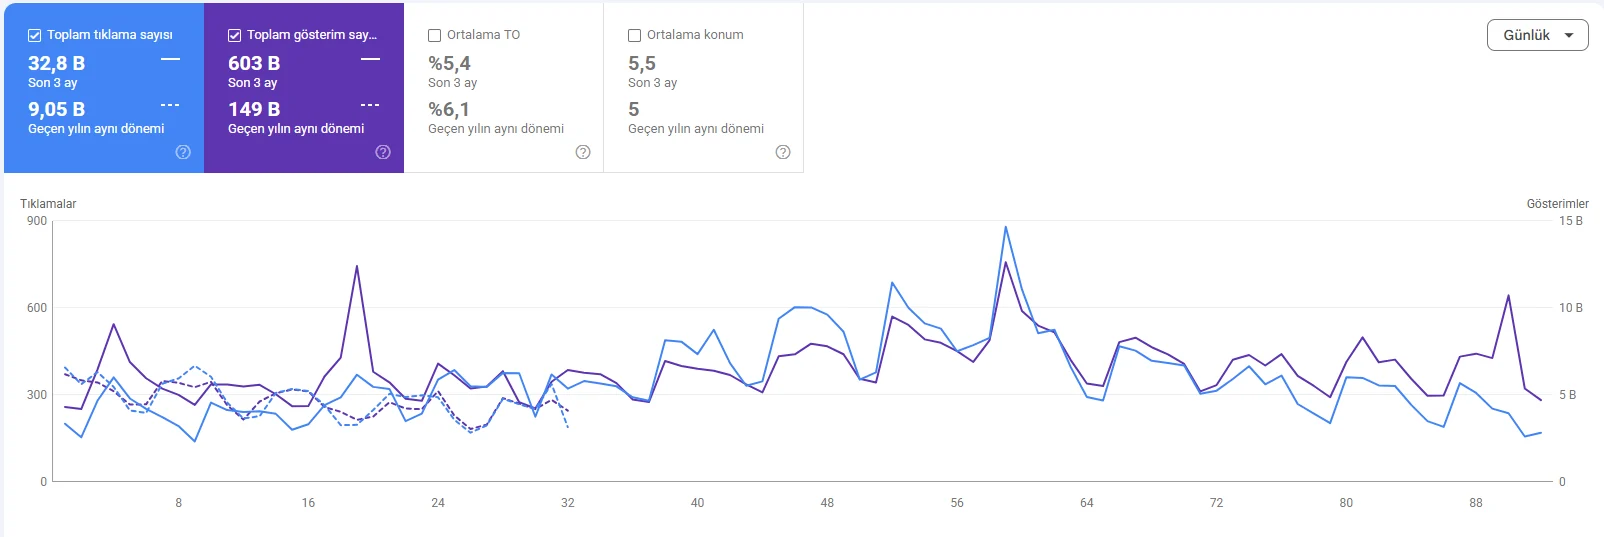
Project 9

Clicks
9,050 → 32.8K
Impressions
149K → 603K
Google Search Console performance chart, project 9, last 3 months: clicks 9,050 to 32.8K, impressions 149K to 603K

Google Search Console, last 3 months vs. the same period last year. Part of the comparison period has no data, so no growth multiple is shown.

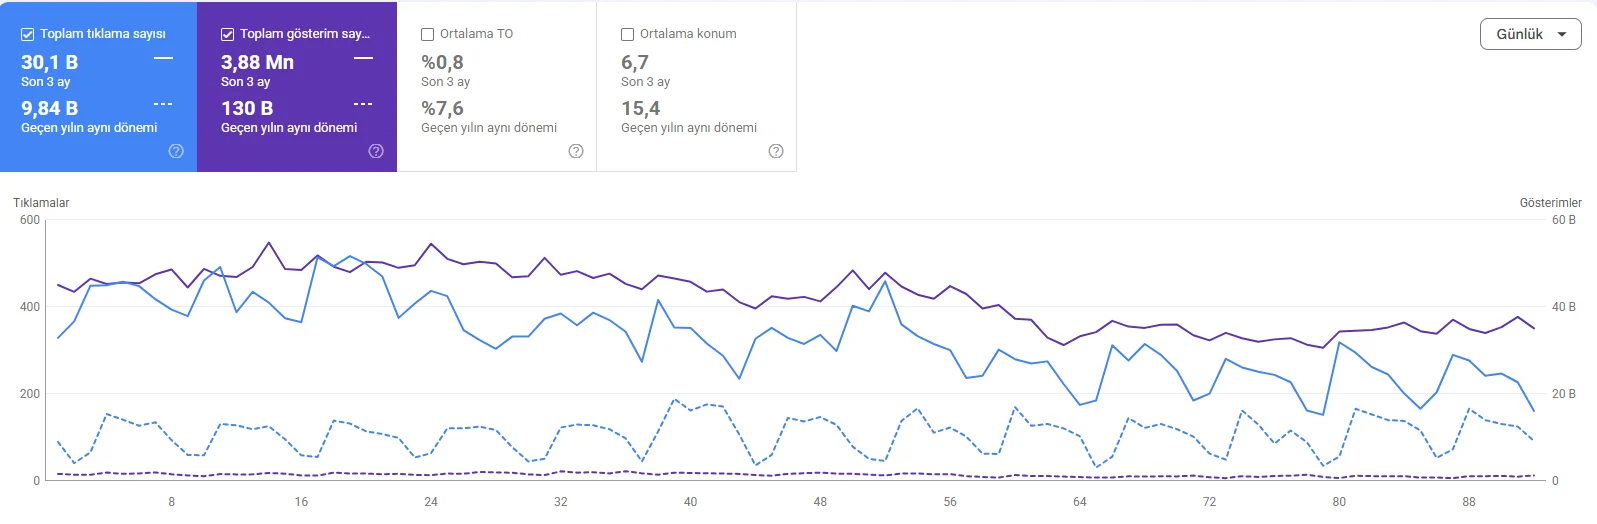
Project 10

Clicks
9,840 → 30.1K
×3.1
Impressions
130K → 3.88M
×30
Google Search Console performance chart, project 10, last 3 months: clicks 9,840 to 30.1K, impressions 130K to 3.88M

Google Search Console, last 3 months vs. the same period last year.

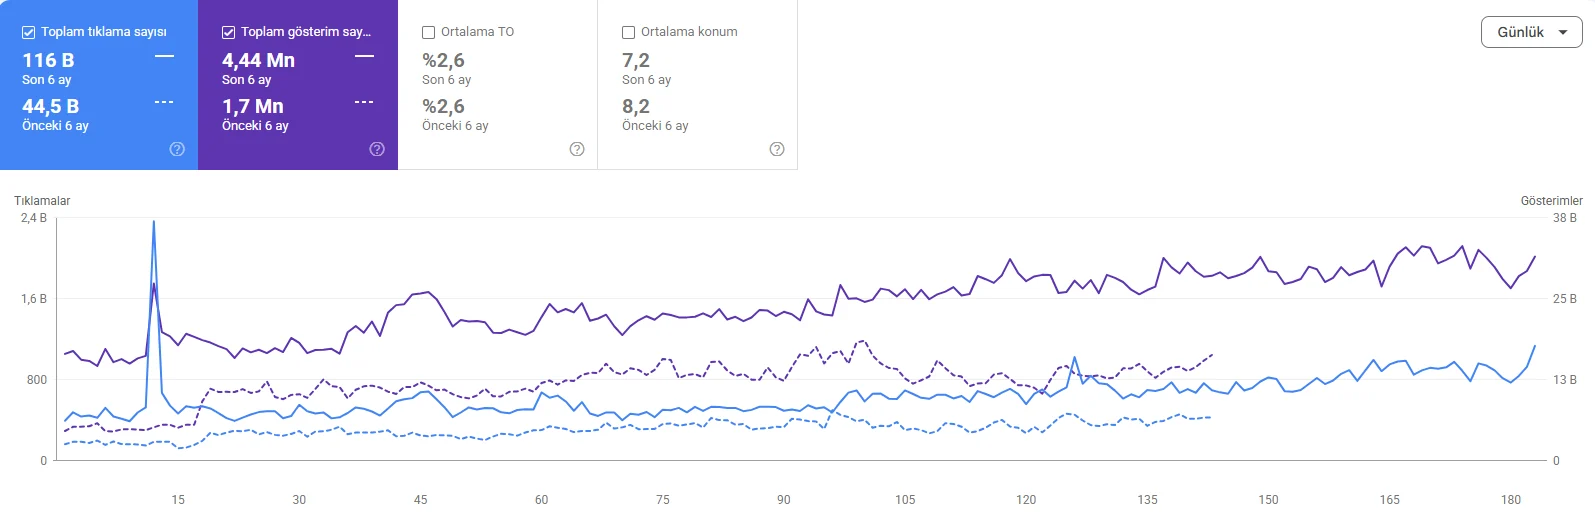
Project 11

Clicks
44.5K → 116K
Impressions
1.7M → 4.44M
Google Search Console performance chart, project 11, last 6 months: clicks 44.5K to 116K, impressions 1.7M to 4.44M

Google Search Console, last 6 months vs. previous 6 months. Part of the comparison period has no data, so no growth multiple is shown.

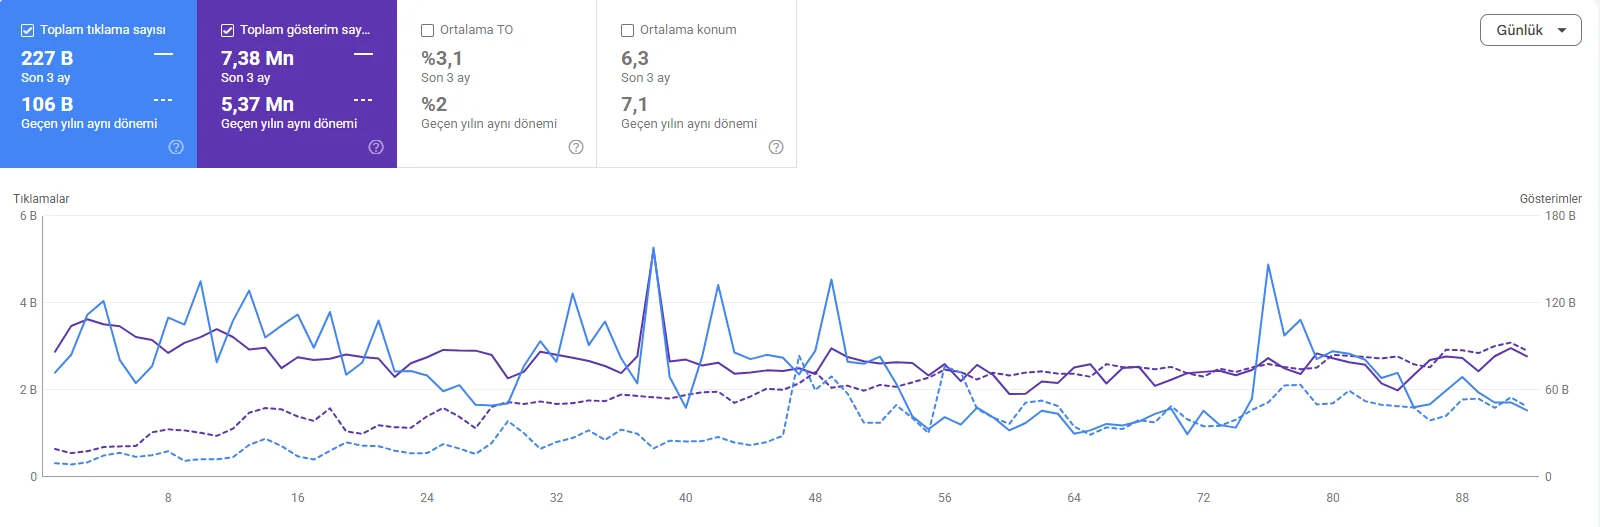
Project 12

Clicks
106K → 227K
×2.1
Impressions
5.37M → 7.38M
+37%
Google Search Console performance chart, project 12, last 3 months: clicks 106K to 227K, impressions 5.37M to 7.38M

Google Search Console, last 3 months vs. the same period last year.

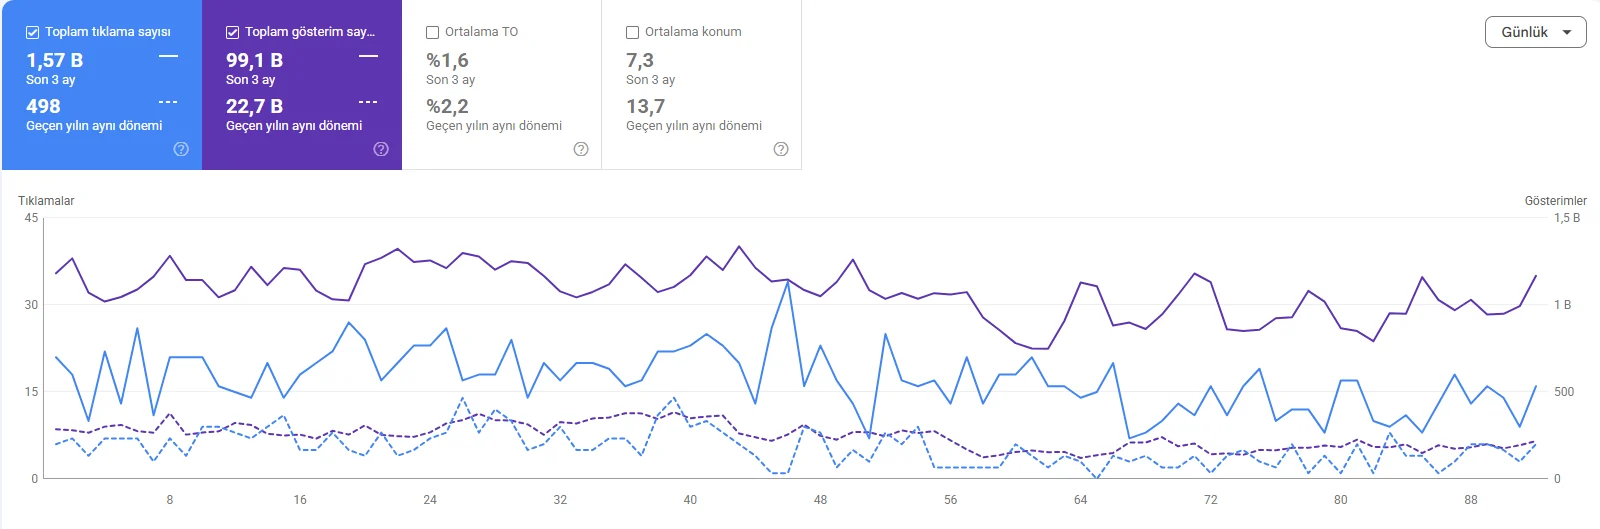
Project 13

Clicks
498 → 1,570
×3.2
Impressions
22.7K → 99.1K
×4.4
Google Search Console performance chart, project 13, last 3 months: clicks 498 to 1,570, impressions 22.7K to 99.1K

Google Search Console, last 3 months vs. the same period last year.

🛍️E-Commerce⏱ 6 months

Textile Brand: 280% Organic Traffic Growth in 6 Months

We tripled organic traffic through comprehensive technical SEO audit and content architecture restructuring.

⚡ Challenge

Achieving organic growth from scratch in a textile segment dominated by competitor brands for years.

💬 Client Testimonial
"

"After working with Fatih for 4 months, our organic traffic grew by 280%. We could track every step transparently."
M
Mehmet A. — E-Commerce Director
📈
Organic Traffic
Before: 18,400/mo
0/mo
+0%
🔑
Ranking Keywords
Before: 892
0+
+0%
💰
Organic Revenue
Before: $8K/mo
$0K/mo
+0%
🌐
Domain Rating
Before: 22
0
+0%
🎯
Conversion Rate
Before: 1.2%
0%
+0%
📉
CAC (Organic)
Before: $14
$0
-0%
▶
Case Study Walkthrough
E-Commerce · 6 months

All Case Studies

🚀

Want Similar Results?

Book a free discovery call and let's plan your growth roadmap together.